The bull market appears poised to extend its run in 2026, fueled by ongoing enthusiasm around AI and further easing of monetary policy from the Federal Reserve (Fed). However, with valuations running high and midterm election years often bringing more volatility, gains may be more tempered in 2026. LPL Research suggests investors maintain current allocations near long-term targets and stay patient for pullbacks to selectively increase equity exposures. Here we feature LPL Research’s stock market for 2026, taken from our Outlook 2026: The Policy Engine.
LPL Research 2026 Stock Market Outlook
A strong 2025 does not mean this advance in the stock market won’t deliver more gains for investors in 2026. Several powerful cycles may help push stocks higher in 2026, most notably the AI investment cycle that has powered technology stocks in 2025. A maturing advance during a Fed rate-cutting cycle with stocks near all-time highs also bodes well for a rewarding 2026, especially given the economy may get a fiscal policy boost as stimulus from the One Big Beautiful Bill Act (OBBBA) kicks in and boosts corporate profits and cash flows. Potential AI disappointments, possible upward pressure on long-term interest rates, renewed global trade tensions, and geopolitical instability will remain key risks for stock investors to monitor. If this outlook seems familiar, that’s because it resembles 2025.
Four Years Into the Rally
The current bull market celebrated its third anniversary on October 12, 2025, marking an impressive run since its inception in inflation-plagued 2022. The S&P 500 surged more than 80% over the first three years of this move higher (excluding dividends), far outpacing historical averages. Stocks have since added to those gains, getting year four off to a good start (+5.3% through December 11).
What might the rest of the fourth year of this upswing have in store? If history is a guide, then the stock market should have more room to run. As shown in the “History Points to a Strong Fourth Year for This Bull Market” chart, the S&P 500 has averaged a 12.8% gain historically during the fourth year of bull markets since 1950, with six positive years out of seven. Further, the average advance lasts over five years, while advances that go at least three years have produced a median gain of 126% and averaged 199% (please note past performance does not guarantee future results).
There Is Potential for a Strong Fourth Year for This Bull Market
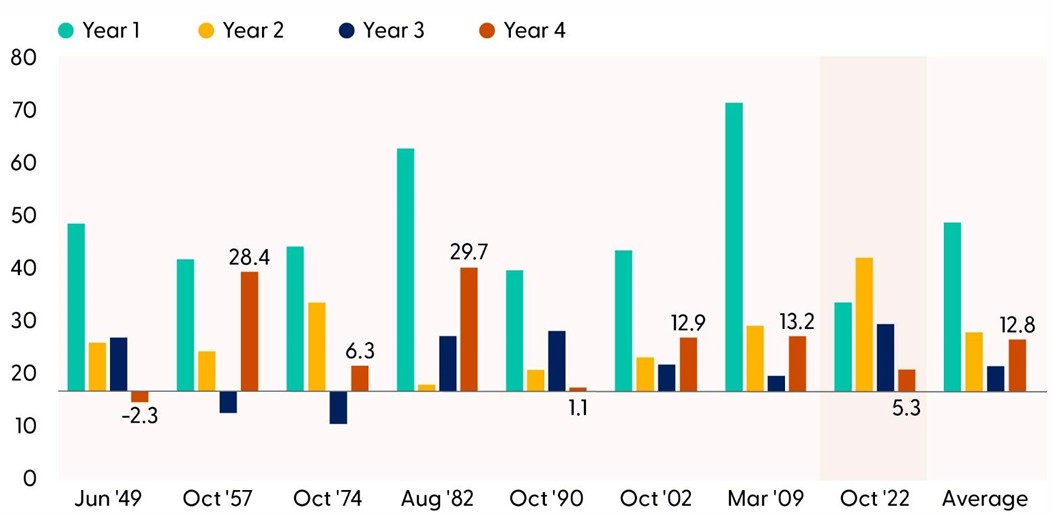
Source: LPL Research, Bloomberg, 12/11/25
Disclosures: Only S&P 500 bull markets that made it through a fourth year are shown, in addition to the current bull market. All indexes are unmanaged and cannot be invested in directly. Past performance is no guarantee of future results. The modern design of the S&P 500 stock index was first launched in 1957. Performance back to 1950 incorporates the performance of the predecessor index, the S&P 90.
Supportive Monetary Policy Cycle
The Fed rate cycle should provide another tailwind for stocks in 2026, as it did in 2025. If the economy holds up, rate-cutting cycles tend to be followed by stock market gains. Stocks prefer rate cuts that are luxuries rather than emergencies — and we would categorize upcoming cuts as the former. The Fed is normalizing rates, not staving off an impending recession.
This rate-cutting cycle is unique because stocks are near all-time highs. In previous instances when the Fed cut rates and stocks were at or near record highs (we found 28 cases), the S&P 500 was 13% higher on average 12 months later, with 93% of those 28 periods producing gains. Filtering that further, when the U.S. economy was not in recession around a rate cut, the average 12-month return for the S&P 500 increased to 18%, with gains in all 21 periods. Near recessions, the S&P 500 lost 2.7% on average in the 12 months after the Fed reduced rates, with only 25% of periods generating a gain.
S&P 500 Performance After Fed Rate Cuts At/Near Record Highs
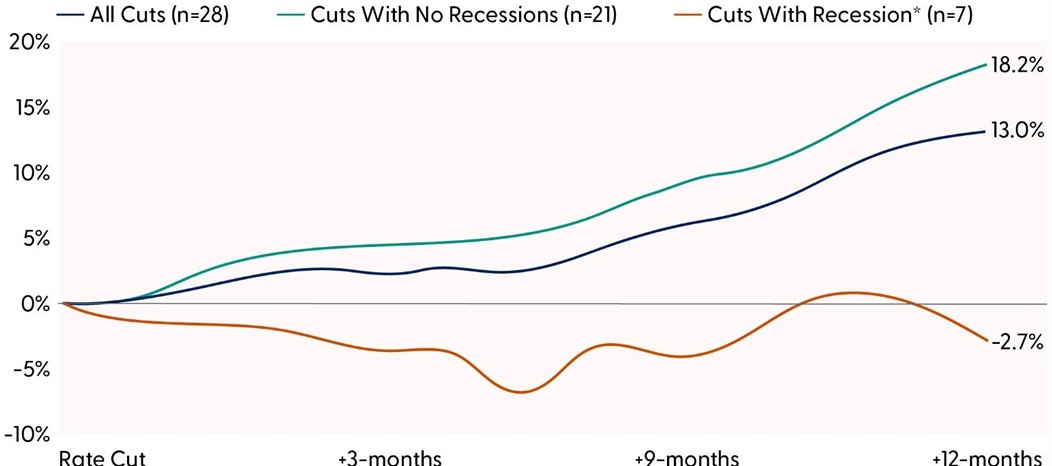
Source: LPL Research, Bloomberg, 12/01/25
Disclosures: At/Near record highs defined as periods when the S&P 500 was within 3% of an all-time high. Data based on dates from 1984-YTD. Cuts with recession are defined as Federal Reserve interest rates occurring within six months of a recession. All indexes are unmanaged and cannot be invested in directly. Past performance is no guarantee of future results.
Massive AI Capex Cycle Still Gaining Steam
Perhaps the most powerful investment cycle affecting stocks is the wave of AI capital investment. Consensus estimates for 2025 capital expenditures (capex) from the five hyperscalers — Alphabet (GOOG/L), Amazon (AMZN), Meta (META), Microsoft (MSFT), and Oracle (ORCL) — in 2025 are expected to come in at around $400 billion. In 2026, the number is now expected to approach $520 billion, a roughly 30% increase over this year’s estimate and an estimated 1.6% of the U.S. economy, measured by nominal gross domestic product (GDP). In terms of dollars that can help drive the economy and corporate profits, nothing is bigger than AI right now, and we believe that is very unlikely to change anytime soon.
Hyperscalers’ Artificial Intelligence Investment Is Massive and Still Increasing Strongly
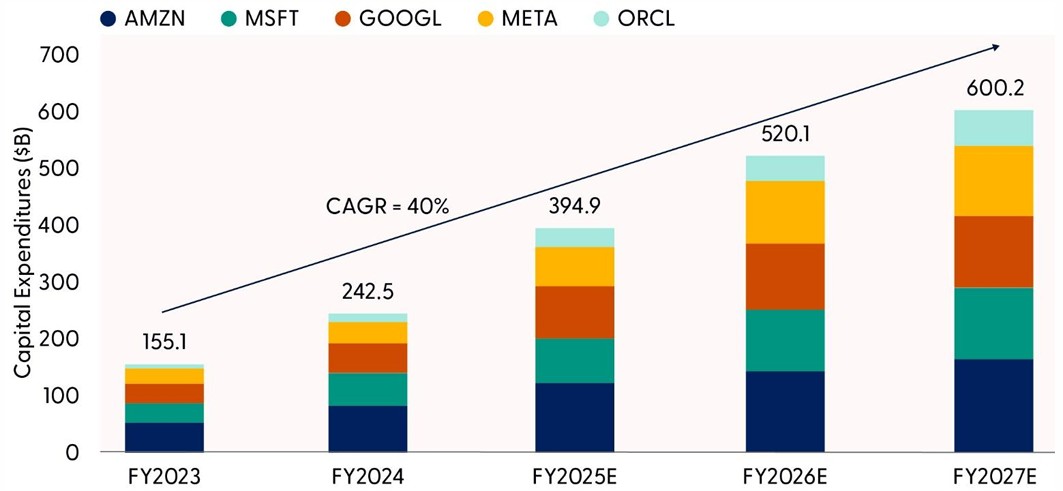
Source: LPL Research, Bloomberg, Company Reports, 12/01/25
Hyperscalers include Alphabet (GOOG/L), Amazon (AMZN), Meta (META), Microsoft (MSFT), and Oracle (ORCL). Past performance is no guarantee of future results.
Disclosures: Past performance is no guarantee of future results. Estimates may not materialize as predicted and are subject to change.
Earnings Riding the AI Wave
The AI frenzy is being reflected in analysts’ expectations for double-digit earnings growth for S&P 500 companies overall both this year and next. The Magnificent Seven has been responsible for more than half of S&P 500 earnings growth the past few quarters and will likely continue to play a significant role in growing earnings in 2026. While the wide gap between the Magnificent Seven’s earnings growth and the rest of the market will likely persist well into 2026, supporting large cap growth stocks, expect this gap to narrow as the year progresses. This is something to watch closely when the calendar turns, as it could spark a market rotation into value stocks.
Magnificent Seven Remains a Powerful Earnings Driver
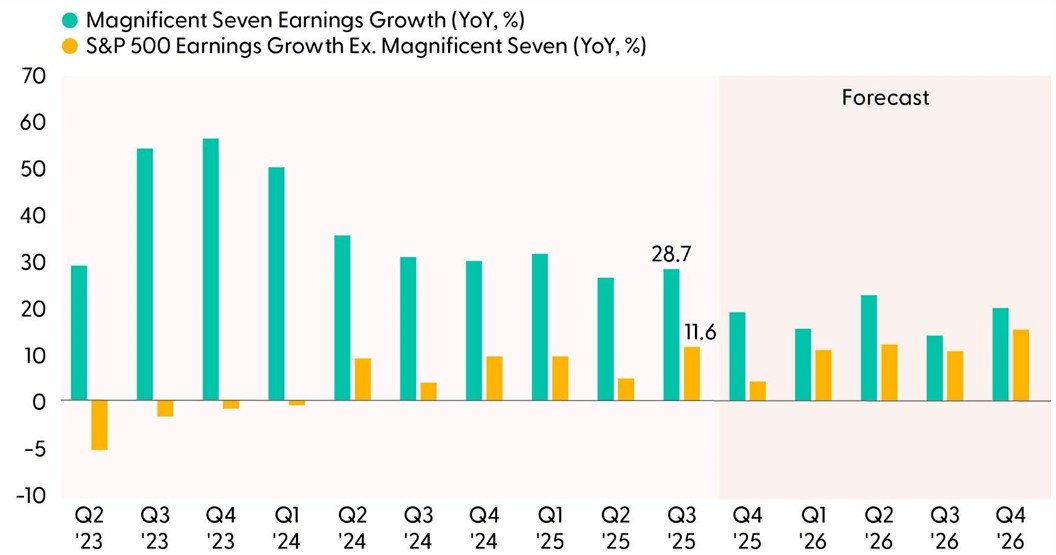
Source: LPL Research, Bloomberg, 12/01/25
Magnificent Seven includes Alphabet (GOOG/L), Amazon (AMZN), Apple (AAPL), Meta (META), Microsoft (MSFT), NVIDIA (NVDA), and Tesla (TSLA).
Disclosures: Past performance is no guarantee of future results. Estimates may not materialize as predicted and are subject to change.
Our Fair Value Year-End 2026 S&P 500 Target Range is 7,300 to 7,400
At the micro level, AI investment will power earnings growth in 2026. On the macro side, we expect continued progress toward the Fed’s 2% inflation target as the economy slows gradually (and then potentially picks back up a bit later in the year), enabling additional Fed rate cuts without triggering a recession. One key difference between 2025 and 2026 will be a shift in policy focus away from trade and tariffs and toward fiscal stimulus and the midterm elections.
This is a favorable backdrop for stocks to at least hold their valuations. But even if corporate profits grow double digits this year and next, it’s difficult to make a case for a higher price-to-earnings ratio (P/E) than the current 22 to 23 times. A growing economy will drive similar mid-single-digit revenue growth as in 2025, while margins are expected to inch higher as tariffs are fully absorbed and benefits from AI increasingly permeate, enabling the potential for double-digit earnings growth.
That means earnings growth rather than P/E multiple expansion will probably have to drive stock prices higher. LPL Research’s year-end 2026 fair value target range on the S&P 500 is 7,300 to 7,400, based on 23 times $320 in S&P 500 earnings per share (EPS) in 2027, a 10% increase from our upwardly revised 2026 estimate of $290 (8% above current 2025 consensus). We place the odds of this scenario at around 60%.
We could envision a path to 7,800 (roughly 13% upside from current prices) by year-end 2026, based on 24 times $325 in S&P 500 EPS, in the event of more significant productivity gains from AI investment. We place the odds of this scenario at about 25%. A downside scenario, with perhaps a 15% probability if AI disappoints and recession fears intensify, could potentially introduce 8–9% of downside from current price levels to the 6,200 to 6,300 range.
The risk that these massive AI spending commitments in the tens and hundreds of billions don’t come through should not be dismissed, particularly given some of it is being financed with debt, and privately held OpenAI (creator of ChatGPT) does not yet have the business model to support its planned investment.
Key Risks Include Market Divergences, AI Froth, and Rising Interest Rates
Among our primary concerns as 2026 approaches, we would point out that market breadth has weakened, with gains increasingly concentrated in a handful of large cap growth stocks, while most others underperform. This narrow participation — which has reversed some in recent weeks — remains a concern regarding the durability of the rally. Other risks warranting a mention include a possible “bubble” in some AI stocks with excessively bullish sentiment as free cash flows begin to deteriorate, a potential sharp rise in interest rates, and geopolitical threats. It is also worth noting that midterm election years tend to be more volatile than average, as discussed on page 13 of
Outlook 2026: The Policy Engine.
The Bottom Line
The stock market in 2026 could look a lot like 2025, as some cyclical drivers from the past year continue in the coming year. We believe this bull market should keep running, as most do at this stage, with support from the AI and rate-cutting cycles. But given rich valuations and the propensity for higher volatility in mid-term years, a lot must go right for stocks to enjoy another strong year like 2025. Still, our best advice is to stay invested in equities at target weights and wait for corrections before considering raising equities exposure to overweight. That opportunity could come soon.
Asset Allocation Insights
LPL’s Strategic and Tactical Asset Allocation Committee (STAAC) maintains its tactical neutral stance on equities as 2025 winds down. Investors may be well served by bracing for occasional bouts of volatility given how much optimism is reflected in stock valuations, but fundamentals remain broadly supportive. Technically, the broad market’s long-term uptrend remains intact, leaving the Committee biased to buy dips that emerge between now and year-end.
STAAC’s regional preferences across the U.S., developed international, and emerging markets (EM) are aligned with benchmarks. The Committee still favors the growth style over its value counterpart, large caps over small caps, and the communication services sector. The Committee is closely searching for opportunities in the healthcare and industrials sector and continues to watch for opportunities in the technology sector to potentially add on weakness.
Within fixed income, the STAAC holds a neutral weight in core bonds, with a slight preference for mortgage-backed securities (MBS) over investment-grade corporates. The Committee believes the risk-reward for core bond sectors (U.S. Treasury, agency MBS, investment-grade corporates) is more attractive than plus sectors. The Committee does not believe adding duration (interest rate sensitivity) at current levels is attractive and remains neutral relative to benchmarks.
Important Disclosures
This material is for general information only and is not intended to provide specific advice or recommendations for any individual. There is no assurance that the views or strategies discussed are suitable for all investors or will yield positive outcomes. Investing involves risks including possible loss of principal. Any economic forecasts set forth may not develop as predicted and are subject to change.
References to markets, asset classes, and sectors are generally regarding the corresponding market index. Indexes are unmanaged statistical composites and cannot be invested into directly. Index performance is not indicative of the performance of any investment and do not reflect fees, expenses, or sales charges. All performance referenced is historical and is no guarantee of future results.
Any company names noted herein are for educational purposes only and not an indication of trading intent or a solicitation of their products or services. LPL Financial doesn’t provide research on individual equities.
All information is believed to be from reliable sources; however, LPL Financial makes no representation as to its completeness or accuracy.
All investing involves risk, including possible loss of principal.
US Treasuries may be considered “safe haven” investments but do carry some degree of risk including interest rate, credit, and market risk. Bonds are subject to market and interest rate risk if sold prior to maturity. Bond values will decline as interest rates rise and bonds are subject to availability and change in price.
The Standard & Poor’s 500 Index (S&P500) is a capitalization-weighted index of 500 stocks designed to measure performance of the broad domestic economy through changes in the aggregate market value of 500 stocks representing all major industries.
The PE ratio (price-to-earnings ratio) is a measure of the price paid for a share relative to the annual net income or profit earned by the firm per share. It is a financial ratio used for valuation: a higher PE ratio means that investors are paying more for each unit of net income, so the stock is more expensive compared to one with lower PE ratio.
Earnings per share (EPS) is the portion of a company’s profit allocated to each outstanding share of common stock. EPS serves as an indicator of a company’s profitability. Earnings per share is generally considered to be the single most important variable in determining a share’s price. It is also a major component used to calculate the price-to-earnings valuation ratio.
All index data from FactSet or Bloomberg.
This research material has been prepared by LPL Financial LLC.
Not Insured by FDIC/NCUA or Any Other Government Agency | Not Bank/Credit Union Guaranteed | Not Bank/Credit Union Deposits or Obligations | May Lose Value
For public use.
Member FINRA/SIPC.
RES-0006412-1125 Tracking #837192 | #837655 (Exp. 12/26)